The pitch deck scoring rubric: 7 dimensions, and where 2,104 decks lose points
The first version of this guide was called "What VCs actually score on, broken down by the 8 dimensions that decide your round". It ranked the dimensions in the order partners supposedly weigh them, and it described a partner reading a deck second by second.
We could not back any of that up. We do not sit in partner meetings. Different investors weigh things differently, and the same investor weighs them differently for a pre-seed deck and a Series A deck. Worse, our own scorer does not even use eight dimensions. It uses seven.
So here is the honest version: the rubric we actually use, what each part looks for, and what happened when 2,104 real decks went through it.
How the score works
When you upload a deck to VC Boom, Claude reads it and scores it from 0 to 100 on seven dimensions: problem, market, solution, business model, traction, team and the ask. The overall score is a weighted view of those seven.
Two things matter about how it is calibrated:
- It is stage-aware. If you tell us the deck is for a pre-seed round, the scorer is told not to penalise missing revenue, projections or unit economics, and to judge traction on early signals such as a waitlist, design partners or letters of intent. A Series A deck is held to a bar that expects real metrics.
- It is told to credit real strengths and not invent gaps. A strong deck should get fewer suggestions, not three generic ones.
It is a model applying a rubric, not a partner making a decision. Treat it like a sharp friend who has read a lot of decks, not like a verdict.
What the score bands mean
The scorer uses four bands, and here is how the 2,104 decks uploaded since April 16, 2026 fell into them.
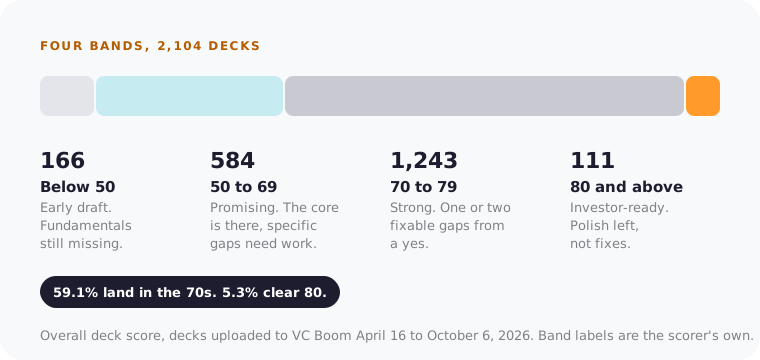
Band labels are the scorer's own. 59.1% of decks land in the 70s.
- 80 and above, investor-ready. Polish left, not fixes. 111 decks, 5.3%.
- 70 to 79, strong. One or two fixable gaps between this and a yes. 1,243 decks.
- 50 to 69, promising. The core is there, specific gaps need work. 584 decks.
- Below 50, early draft. Fundamentals still missing. 166 decks.
The median is 72. If your deck is in the 70s, you are where most founders are. The gap to 80 is usually one or two slides, not a rebuild.
Where decks lose points
Here is the average score on each dimension across all 2,104 decks.
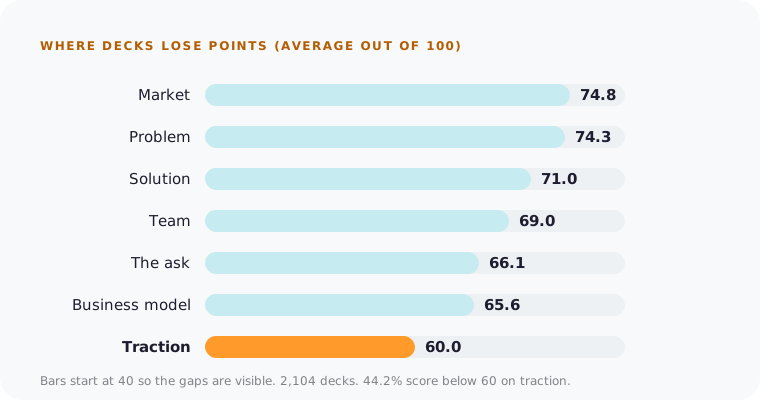
Market 74.8, problem 74.3, solution 71.0, team 69.0, ask 66.1, business model 65.6, traction 60.0.
Traction is the weakest, and not by a little. 44.2% of decks score below 60 on it. Business model and the ask come next. Market and problem are where decks do best.
That pattern makes sense when you think about how decks get written. Founders spend a long time on why the problem matters and how big the market is. Those slides are fun to write. The traction slide is where you have to show what has actually happened, and the ask is where you have to commit to numbers. Those are harder.
The seven dimensions, one by one
Problem (average 74.3)
What it looks for: a specific buyer with a specific, costly problem, and why today's options fail them. "Payments are broken" is a category. "Clinic managers spend most of Monday reconciling bookings across three systems" is a problem.
Market (average 74.8)
What it looks for: a market size you can defend, built from the bottom up (how many buyers, at what price), plus a reason the market is moving now. A top-down "the global X market is $50B" is the most common way to lose points here.
Solution (average 71.0)
What it looks for: what you built, shown simply, and why it is hard to copy. One clear visual of the core workflow beats six screenshots.
Business model (average 65.6)
What it looks for: how you charge, at what price, and the unit economics you have today, even if early. Projections without any current numbers are where this score drops.
Traction (average 60.0)
What it looks for depends on stage. At pre-seed: early signals that people want this, such as design partners, a waitlist that converts, pilots, letters of intent. At seed: early usage or revenue. At Series A: repeatable revenue, growth and retention, with numbers.
The most common problems are vanity metrics (sign-ups with no usage), numbers with no dates, and traction buried on slide 11. Put it early. Date it. Our 12-slide deck guide puts it fourth for this reason.
Team (average 69.0)
What it looks for: why these people, for this problem. Founder-market fit, and evidence of things shipped rather than job titles. Honest gaps, with a plan to fill them, read better than a slide that pretends the team is complete.
The ask (average 66.1)
What it looks for: how much, on what terms, and what milestones the money buys. "Raising a seed round to scale" scores low. "$1.5M on a post-money SAFE for 18 months to reach $50K MRR and 40 customers" scores well. If SAFEs are new to you, our SAFE guide covers the terms.
One slide, before and after
Here is a hypothetical seed-stage traction slide, the kind that scores in the 50s:
Traction. Strong early interest. Growing user base. Pilots with leading logistics companies. Very positive feedback.
Nothing on it can be checked. Here is the same company, rewritten with facts only:
Traction. 3 paid pilots since March (two regional carriers, one 3PL). $4,800 MRR. 2 of 3 pilots have asked for more depots. 11 more carriers on the waitlist from one trade show in May.
The company is made up. The difference is the point: numbers, dates, and the kind of customer, all things an investor can ask about on a call. In our experience it is the cheapest fix in most decks.
What the score does not tell you
The score tells you how clearly your deck makes its case. It does not tell you whether an investor will fund you. We have not yet linked deck scores to reply rates or to closed rounds, and we explain why in our guide on deck score and investor replies. A 90 sent to the wrong investors still gets silence.
What to do this week
- Score your deck. Note the overall score and the three lowest dimensions.
- Read the lowest one first. Across all decks, the lowest on average are traction, business model and the ask, but yours may differ.
- Rewrite that one slide. Not the whole deck.
- Rescore. If the dimension moved, move on to the next lowest.
- Stop at the 70s or 80s and start sending. Most decks we see are in the 70s. The deck does not have to be perfect for the outreach to start.
See your own breakdown
VC Boom scores your deck across all seven dimensions, shows you which slide to fix first, and suggests the specific rewrite. Then it ranks investors who fit your stage, sector and check size, from the 47,874 we track.
Score your deck for free and see which dimension is costing you.